STORY OF THE MONTH
From polls to pulses: An introduction to concentration inequalities.
 Jan 2024
  Vaisakh Mannalath
In the heart of Utopia, a bustling city, two political giants were locked in a fierce battle for leadership. The air buzzed with anticipation as the election day drew closer. Amidst this charged atmosphere, a prestigious news company, ‘Utopia News’ (UN), embarked on a mission: to predict the election’s outcome before the final votes were tallied. UN couldn’t possibly ask every citizen whom they voted for; it was impractical, like holding another election. So, they decided to conduct a poll. They chose a small, diverse group of people, hoping this sample would represent the nation’s voice.
UN’s analysts worked tirelessly, gathering their poll data. Since this is Utopia, a perfect world, the analysts knew their samples were perfect – people are truthful and unwavering in their opinion; meaning that the samples could be treated as independent random variables. However, since the size of this sample population is very small compared to the population of Utopia, there’s the possibility of deviation in results between the sample poll and the actual election. How can the UN quantitatively bound the inevitable error in their analysis?
Now, here’s where our tale intertwines with the intriguing world of probability theory, specifically concentration inequalities. These mathematical principles would be the UN’s crystal ball. Concentration inequalities, simply put, help in understanding how a small sample can reflect a larger population. They’re like a magnifying glass focusing on the likelihood of a sample’s accuracy. With concentration inequalities, they could estimate how close their poll might be to the actual result and with what probability. This method provided a way to quantify the ‘uncertainty’ – the difference between their poll’s prediction and the real election outcome.
At the heart of concentration inequalities lies a mathematical theorem known as the law of large numbers. It states that sums of independent random variables concentrate around their expectation with a high probability. Different concentration inequalities use varying amounts of information about the random variable. In our specific case, the random variables could be thought of as the fraction of votes in favor of a party, say Party A, from the polling sample. The expectation value of this random variable would be the fraction of votes in favor of Party A in an actual election. As mentioned before, in Utopia, the random variables can be considered independent. There are many concentration inequalities for which independence is a sufficient condition. Let’s see one such specific inequality that can help the UN in its predictions.
Enter the Hoeffding Inequality. This mathematical principle would help the UN estimate the accuracy of their sample. The Hoeffding Inequality states that for a sample of independent random variables, the probability that the sample average significantly deviates from the expected value is exponentially small. Denoting X as the random variable,i.e. fraction of votes in favor of Party A in the sample poll, and E[X] as the expectation values of the random variable, i.e. fraction of votes in favor of Party A in the actual election, Hoeffding inequality states that,

Here δ is the deviation of the observed value from the expected value. We can set the value of δ which would then fix the RHS of the equation. Conversely, we could fix RHS and derive the corresponding δ.
Let us plug in the data UN analysts obtained to make more sense of it. Let’s say they sampled 1000 people out of the entire population of Utopia and recorded their preferences. In their poll, 600 out of 1000 voters preferred Party A, indicating a 60% preference. UN fixes δ at 10% since if the percentage of votes decreases by more than 10% Party A would no longer be the majority.
Plugging numbers in the Hoeffding Inequality,
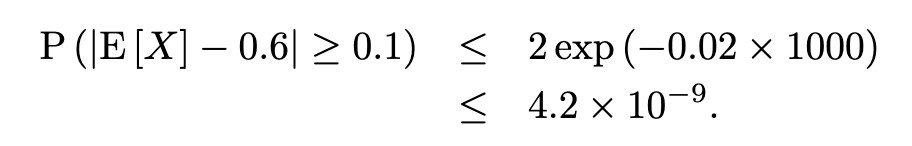
This result means that the probability of their poll being more than 10% off from the actual preference was a negligible value. Party A is practically assured a victory in the upcoming election.
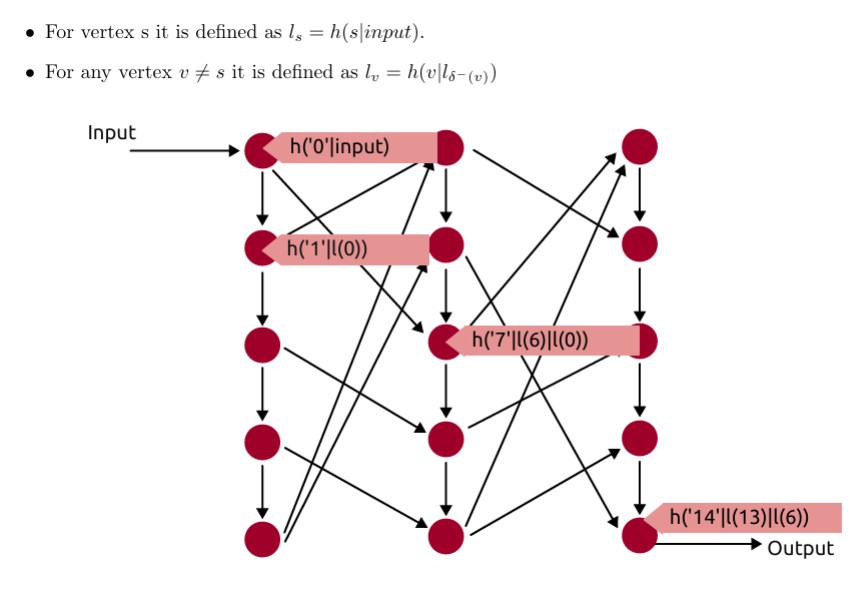
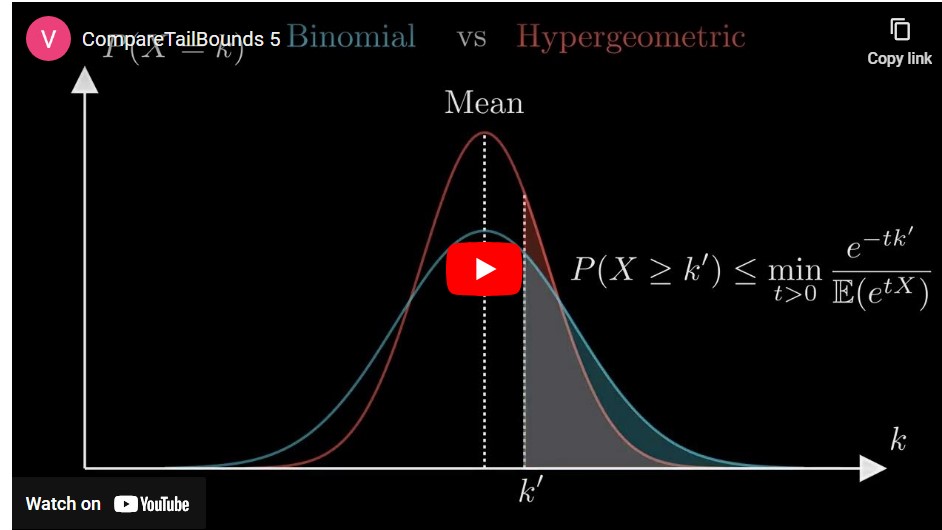
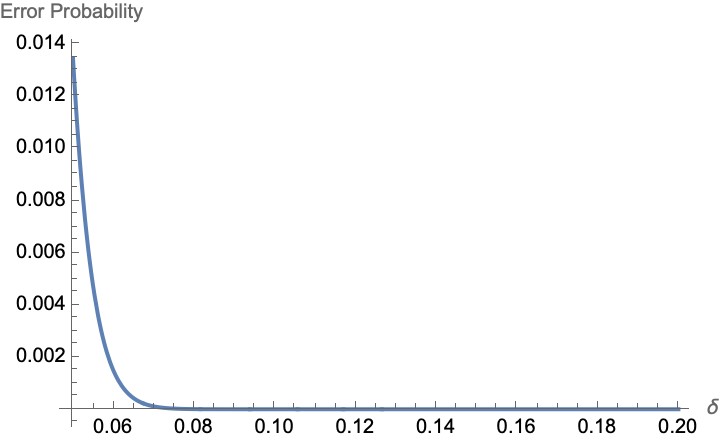
The plot below shows how the error probability varies with δ for the sample size of 1000 people.
The example above was meant to showcase the fundamental role played by concentration inequalities in probability theory and statistics. These inequalities provide bounds on the probability that a sum or average of random variables deviates significantly from its expected value, offering a way to quantify the uncertainty inherent in random processes. This is particularly valuable in fields where decisions are based on incomplete or sample data, such as in machine learning, statistical physics, finance, and as we’ve just seen, election polling. The power of concentration inequalities lies in their ability to offer rigorous guarantees about the behavior of complex systems involving randomness. For example, they enable data scientists to assess the reliability of predictions made by machine learning models, or help political analysts understand the likely accuracy of election polls based on small sample sizes. Just as concentration inequalities aid in predicting election outcomes, they play a crucial role in the realm of Quantum Key Distribution (QKD), a field at the intersection of quantum physics and cryptography. Concentration inequalities are used to ensure the security and robustness of communication channels against potential eavesdropping.
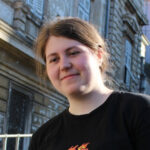
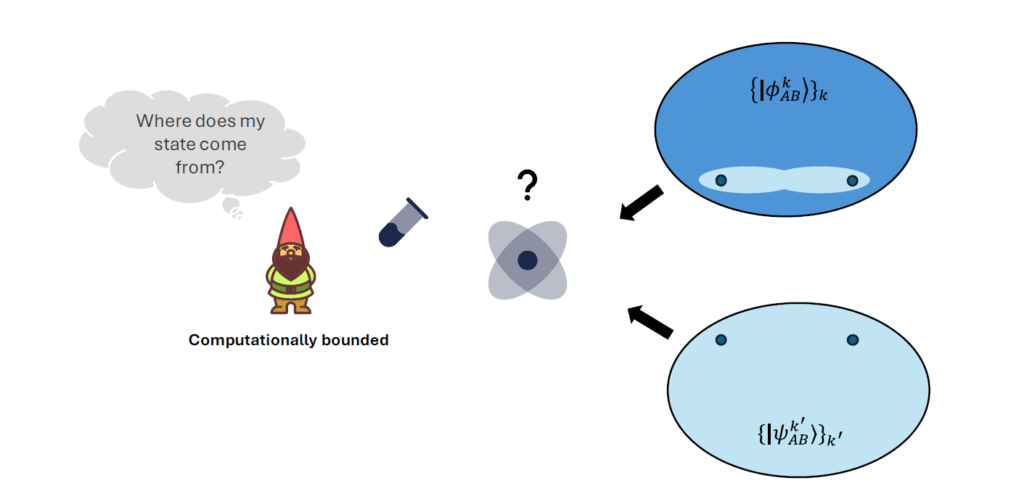
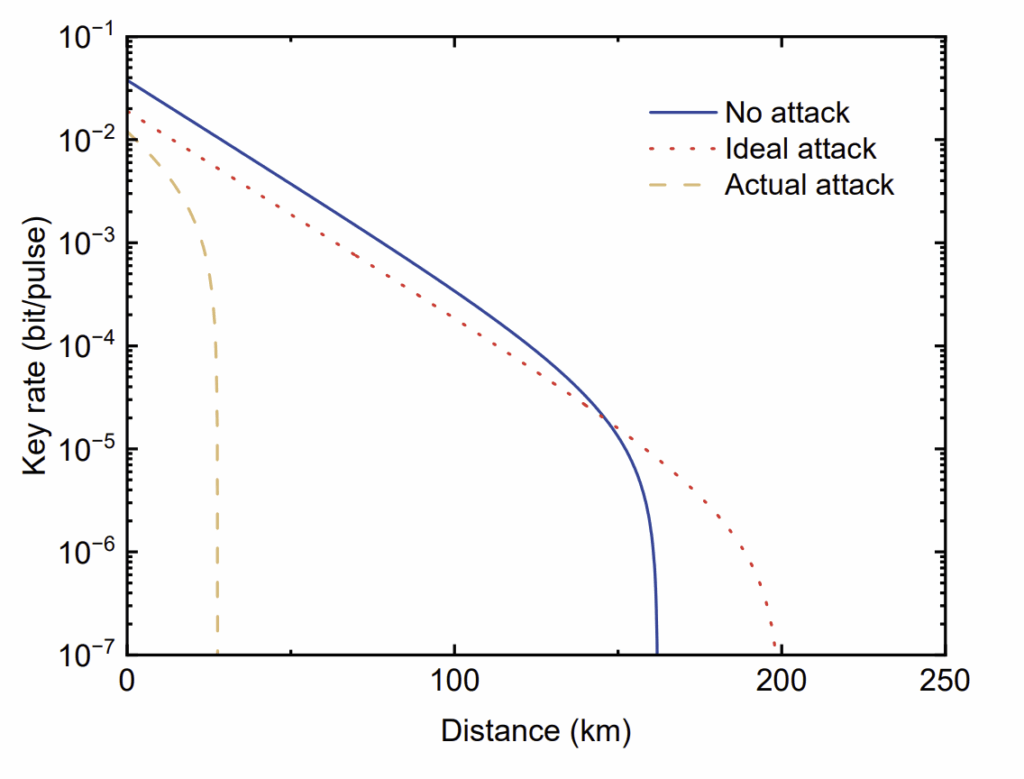
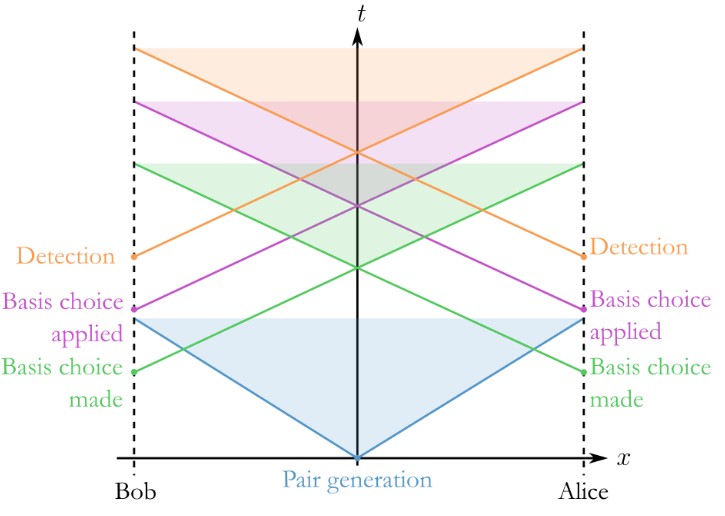
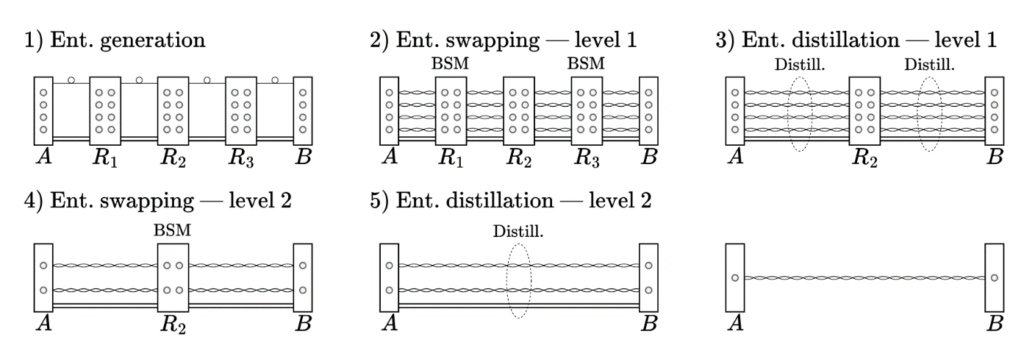
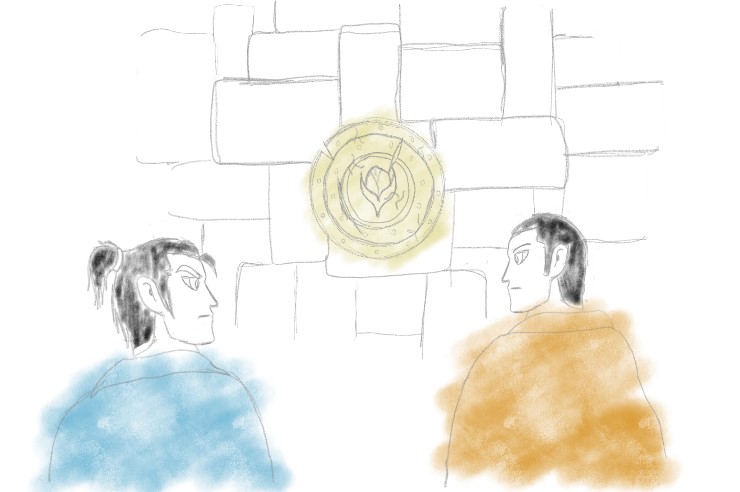
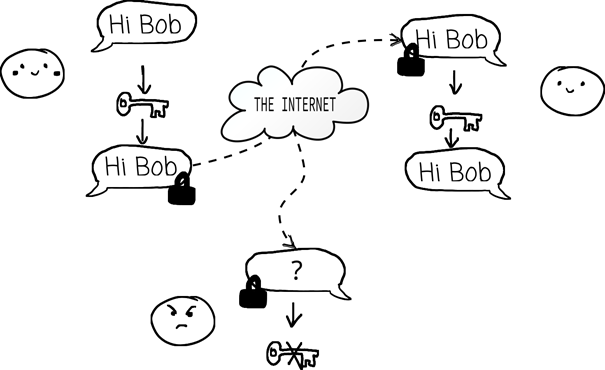
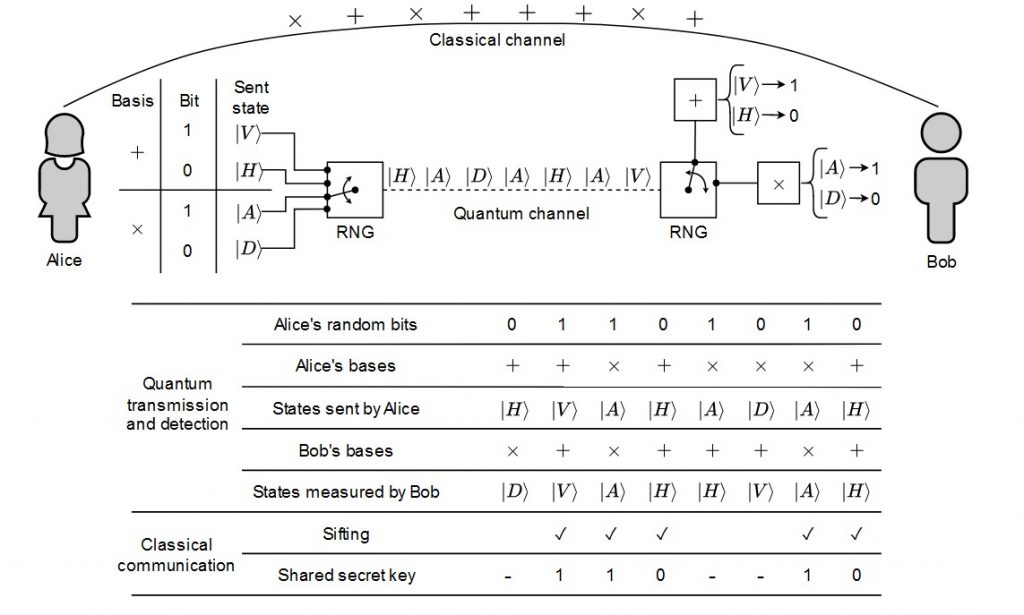
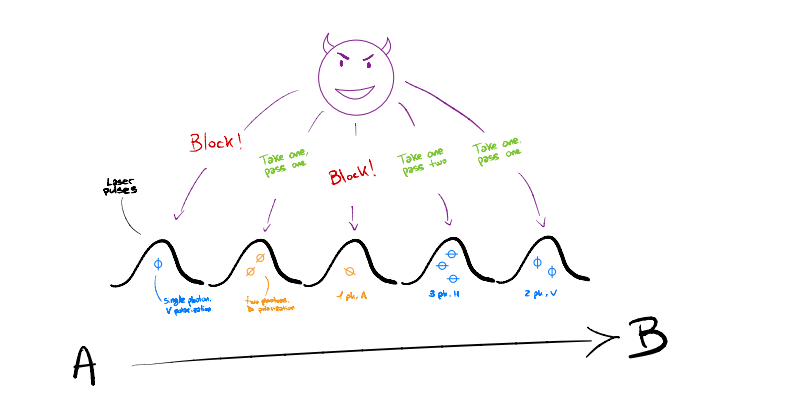
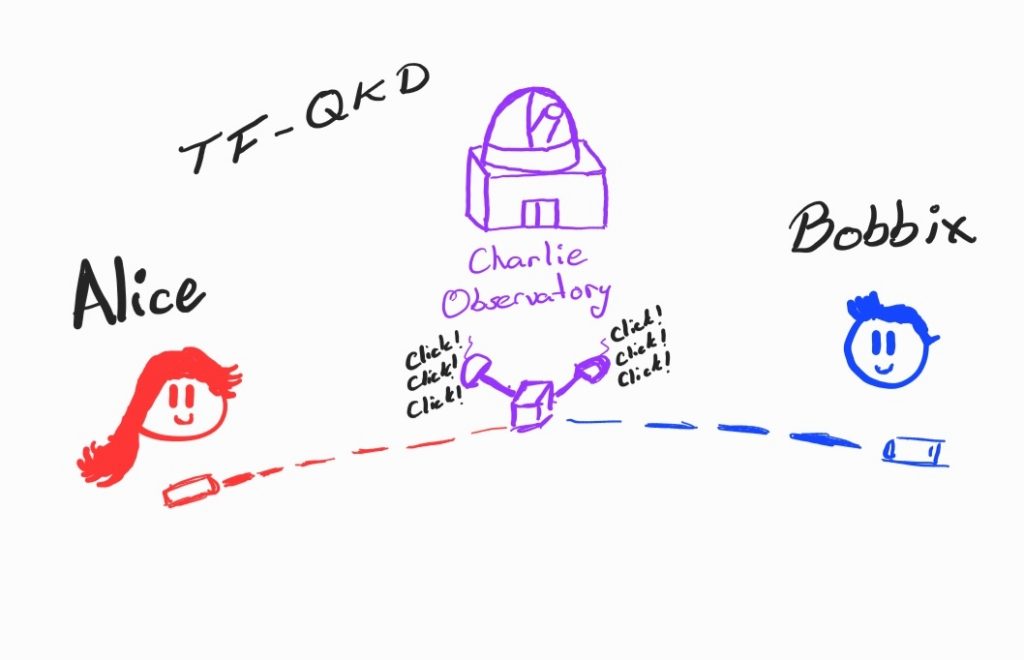
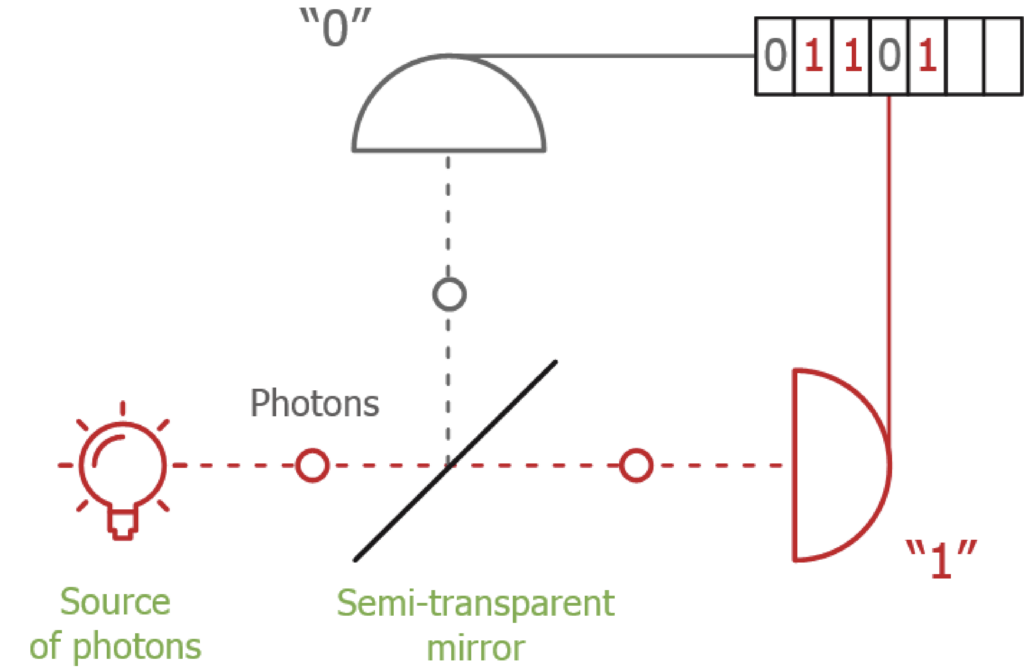
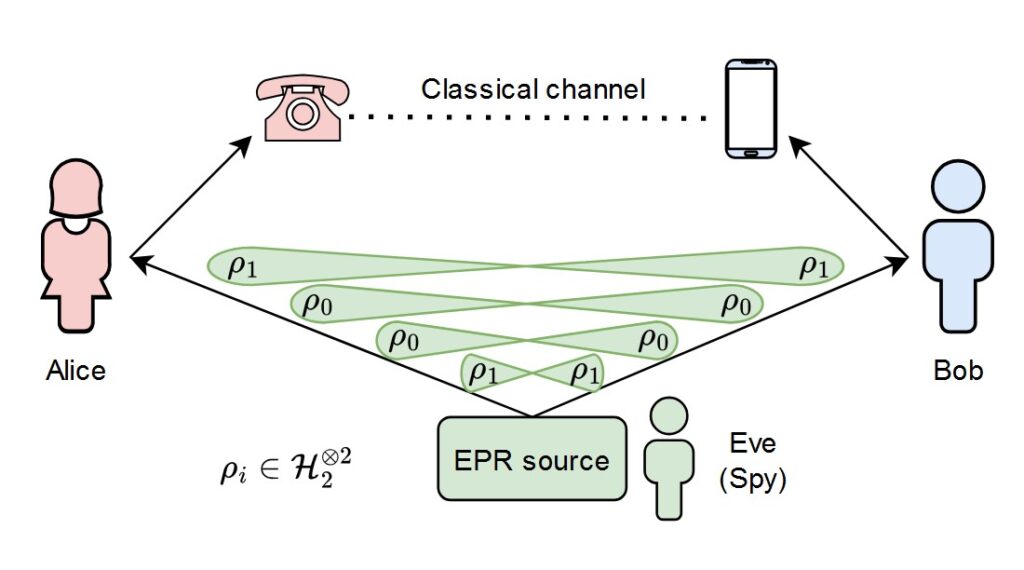
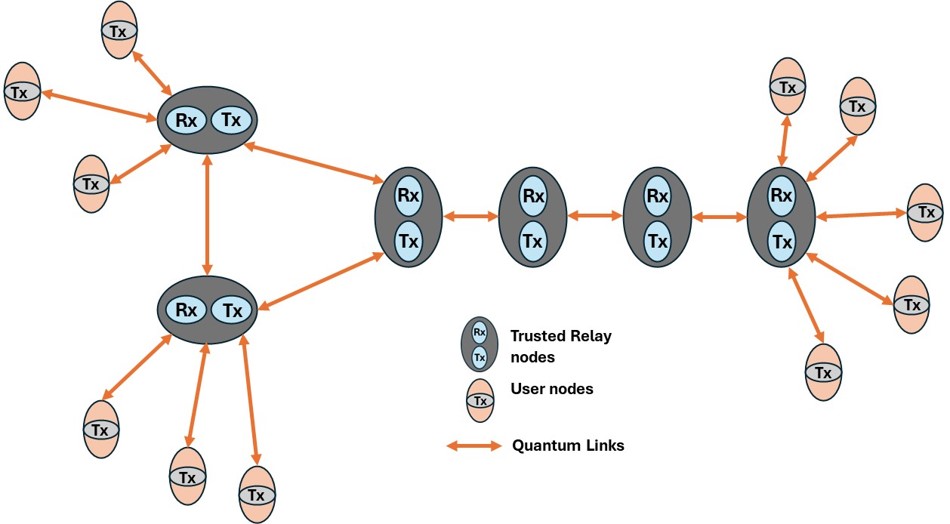
In QKD, Alice and Bob, the quintessential characters in any cryptographic narrative, endeavor to share a secret key under the watchful presence of an adversary, Eve. The process involves sending quantum states (like photons) over a communication channel and measuring these states at the receiving end. Due to the quantum nature of these particles, their measurements are subject to uncertainty and noise, much like the prediction uncertainties in election polling. A part of my research has been dedicated to improving such concentration inequalities in the context of QKD. Articles of previous months have done a beautiful job of explaining QKD. Without going into much detail, I’ll introduce how concentration inequalities find applications in QKD. For this purpose, I’ll connect the QKD to the election example we started out with. The ultimate goal of any QKD protocol is to establish a secret key. For this, we need to estimate various quantities that are not directly observed, similar to how the UN tried to estimate the election results before the elections. Examples of such quantities include the single photon pulses and their phase error rates. Estimating such quantities utilizes the expectation value of some observables in the experiment. Concentration inequality helps us associate the values observed in an experiment with the corresponding expectation value. Hence focus on refining these inequalities helps to increase the efficiency of QKD systems. By developing tighter bounds and more accurate estimations, we can enhance the key rate and extend the practical range of QKD systems. This advancement is crucial, especially as we move towards integrating QKD into global communication networks.
OTHER STORIES